If you ever started a little project, that grew and grew till it seemingly took over your whole life, then you can imagine what’s going on in my life, with respect to @endmyopia, right now.
It’s like you just were going to get your vintage car ready for spring, replace a few chrome pieces. Next thing you know, the entire car is down to the frame, and you’re in a full on three year restoration project. Or you were just planning on painting that one living room wall and now you’re waking up to having torn down and remodeling the whole kitchen and two bathrooms.
That my friends, is @endmyopia.
Hey, ok, I’ll just post some of my how-to guides online, I tell myself (a couple years back, now?). No big deal. Maintain an already built resource a little bit. Answer questions in the support forum for a few participants? Yea sure, why not. An hour or two a week, a little spare time project.
No. Big. Deal.
Fast forward to today. Now we’re at the stage of where big time ophthalmology PhD’s and academic researchers are asking about data. Jake, you have a system. Where is the resulting data about results? Is it organized and normalized and cataloged and what’s your population sample and participant demographic details?
Don’t care, I used to tell them. This resource is about helping people who want to get rid of myopia, not an academia circle jerk.
Then though while you’re polishing that car chrome piece, or painting your living room, you get to thinking. While we’re already at it … why not collect some data. It’d be nice, wouldn’t it, an airy bright kitchen. Nice, having graphs and charts of how everybody is doing with their eyes. Raise confidence, keep everybody on track, and also show the academics that we know what we’re doing.
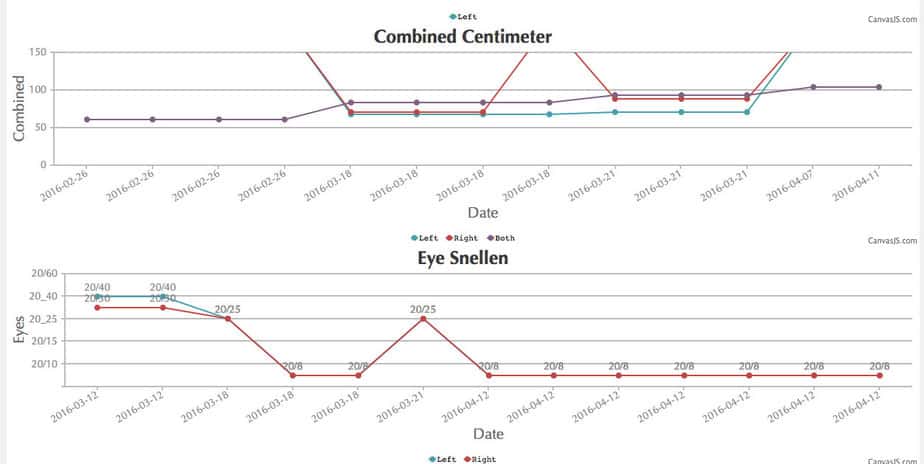
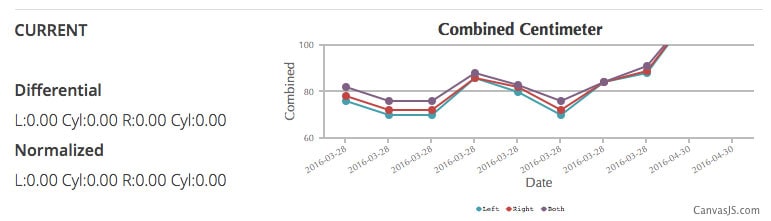
Long story short? You’re probably seeing chart things pop up in your profile, and progress summaries in some participant forum signatures. It’s the new log system flickering to life, as we’re flipping the switches on various parts (trying not to break too many other things).
The user interface isn’t super amazing (for now). And there’ll be bugs.
Awesomely, you’ll start to be able to use the logging tool to keep track of your prescriptions and centimeters. You’ll be able to look back to last month, and six months ago, and last year, and marvel at your improvement. I’ll be able to peak at your log for you, and help make suggestions when I see you hitting plateaus or getting stuck. Little by little, we’ll keep making @endmyopia better and better, for everybody.
And if you’re just a blog reader, I’m sure we’ll post some of the highlights here as well. ;)
Forum signatures. Still a bit of a mess!
You’ll be seeing a reminder popup to add your own data periodically, if you are a member. Try it out, and do leave feedback. The interface prettiness (and usability) is going to be the next thing to tackle, once we got the mechanics of it working reasonably well.
Since we keep the invite volume to BackTo20/20 fairly small, this all hopefully should work out fairly smoothly. Looking forward to seeing your progress! ;)
Cheers,
-Jake
Reading about it won't change your number
Get the whole system for $1.
The method scattered across this blog — in order, start to finish. Plus the private forum and Jake's review of your numbers. 14 days, one dollar.
Where are your eyes now? Tap your prescription:
"I write this blog. I also built the step-by-step system behind it — and I'll look at your numbers personally." — Jake Steiner
Real, documented: Helmut, 77 — −5.25 → −1.50 D · 60,000+ members · 12 years
$1,188 $1 today · cancel in two clicks · 60-day money-back