If you want to be successful at anything that requires a long period effort, you will want to find a way to quantify your progress.
This of course, no secret. There are smartphone apps to quantify and track just about anything you might do. People love those apps. Also you might say, Jake, so where’s the myopia control tracking app?
Patience, I would say.
But, quantify. If you don’t quantify and track progress, then you will be thrown around by emotional peaks and valleys, so much like a tiny boat in an endless ocean. How you “feel” about progress is meaningless. Hard data, something you can chart, look at dispassionately, objectively, that’s what you need.
I just started a personal project to get my weight back up past skinny, for which I’m using a calorie tracking app. (Seriously, I’m down to 70kg. You probably noticed in the videos, and this is definitely not Jakey’s normal weight. Blame Asian food and not going to the gym.)
So, Jake, you say. Where’s the myopia tracking app, then?
To which I’d say to you ….
No, not patience. It’s just that committing to any sort of app related development is like adopting a puppy. It’s going to need a lot of attention and grooming, and it’ll chew the carpet and pee in your shoe (or my shoe, rather). And it’ll keep growing and eat more and continue to need more attention. Bugs, feature requests, random break downs, disappearing programmers. Like a puppy, only worse.
And in true form with most things here, it’s not like it’s going to make any money. Other than the cheapest ever niche specific health related coaching of all human history, I don’t even sell things here. An industrious spirit would have a shop here with shirts and branded test lens kits and dollar subscriptions to printable eye charts, and eye vitamins, and some affiliate program with e-commerce optic shops. Books and speaking engagements and seminars. You know, how people monetize their following in general.
But since endmyopia isn’t my income related focus, an app will just be another way to take up time and money.
But, quantify. We really should have something.
Some of our awesome students do great work on their own, with Excel generated fancy charts. This is what we need, for everybody.
I want students to be able to see everybody’s progress (for those who opt for showing it). I want to be able to take data on a large scale, all formatted equally, to use in studies and science and publishing. I want you to be able to easily and motivating-ly quantify your progress.
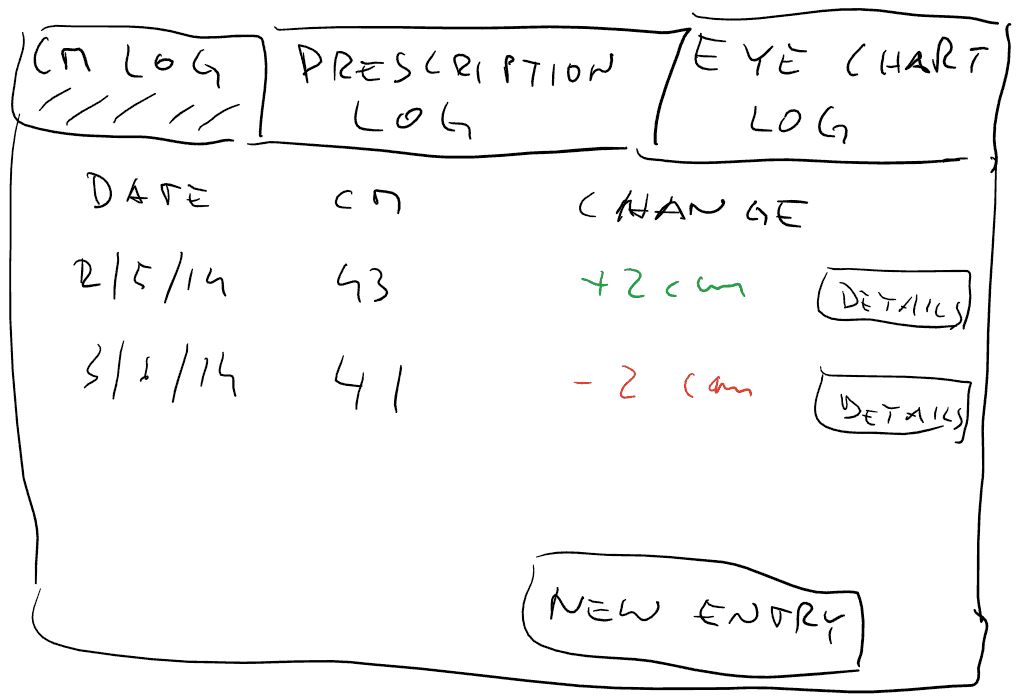
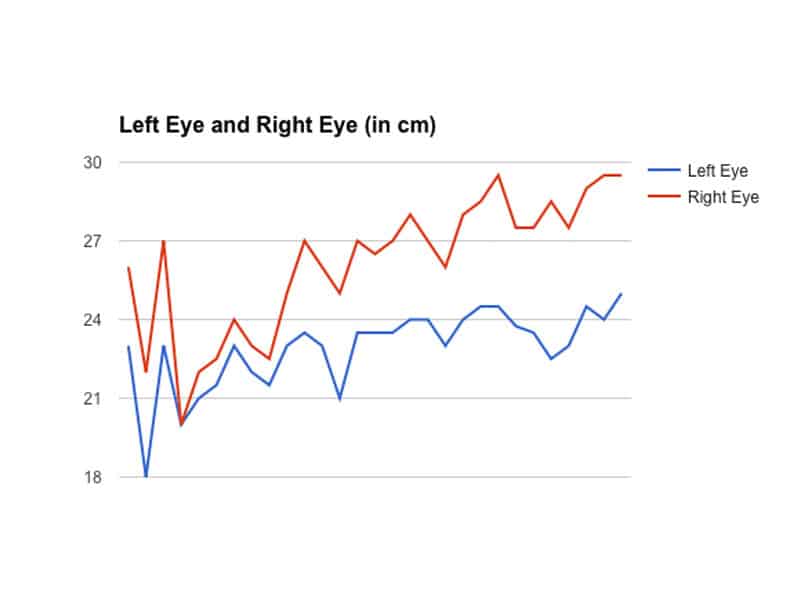
What would be cooler than some awesome graphs, showing your progress over time? Centimeters, compared to Snellen, and even adding your prescription changes to the mix?
Let’s try.
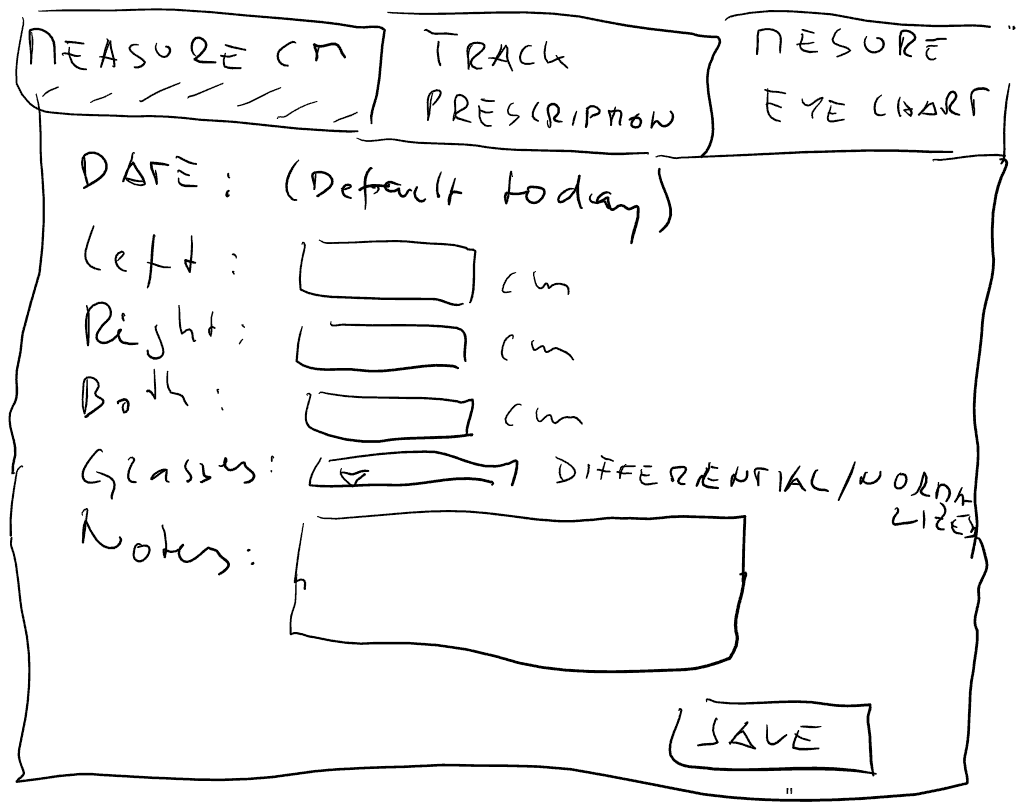
So I hired a developer to make a beta version 0.1, with the basics. Database, a way for you to input data, and see log history, and make some basic charts. If that all comes together reasonably well, maybe we’ll do a mobile / smartphone / tablet version and expand the features later.
 It’ll be students only for the foreseeable future, to be available through the forum.
And since I’ve been limiting BackTo20/20 invites to around 10 a month, we should have an easy enough time to figure out bugs on small scale, and see how it goes. If we can get it all working, you’ll even be able to click on other member’s name in the forum and see their progress (opt-in, of course).
This might lend itself well to advanced functions later, like giving you progress goals, expected reductions over time, perhaps even ways to track your close-up use and remind you to take breaks.
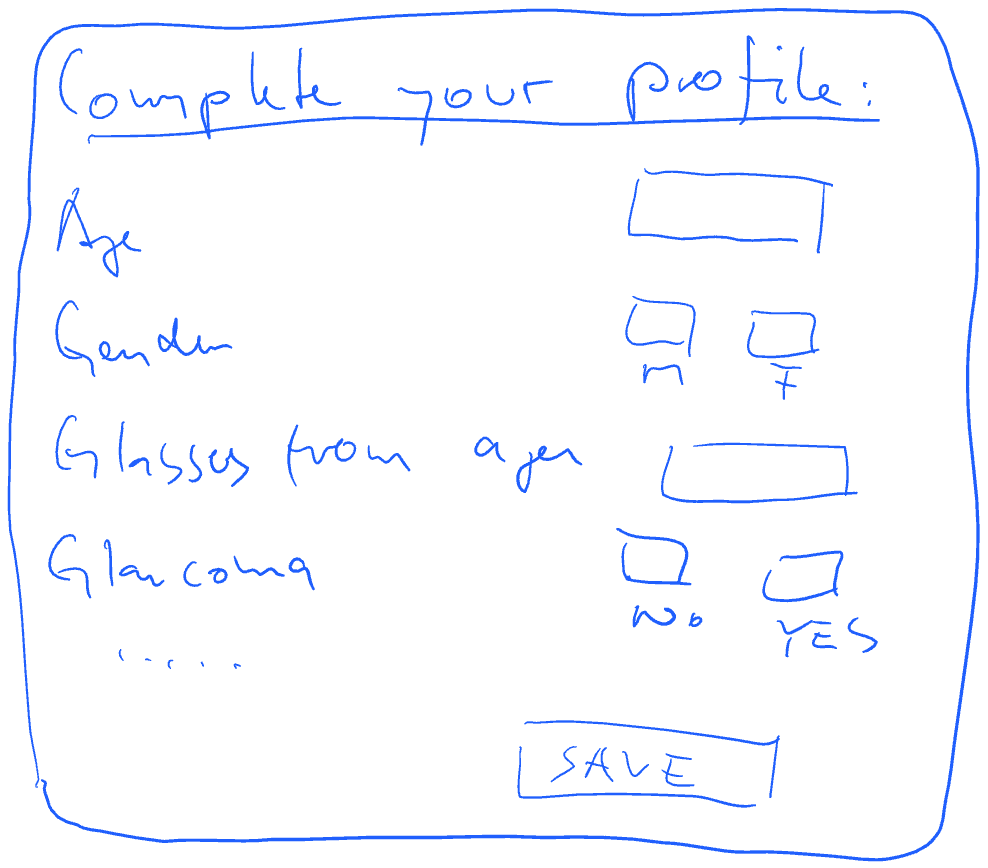
Though for a start, even having just a decent profile, and a basic log would be miles better than the DIY you are having to do, today.
 This, as most things, on the R&D front. No guaranteed results here, just a quick heads up on some of the things going on behind the scenes.
Hopefully we’ll have something to play with later in January. Fingers crossed!
Cheers,
-Jake
You don't have to watch it climb
Stop the slide. Start walking it back.
On glasses, your number drifts up a little every year. The trial hands you the step-by-step to reverse the direction — with Jake checking your numbers.
Where are your eyes now? Tap your prescription:

"I write this blog. I also built the step-by-step system behind it — and I'll look at your numbers personally." — Jake Steiner
Real, documented: Helmut, 77 — −5.25 → −1.50 D · 60,000+ members · 12 years
$1,188 $1 today · cancel in two clicks · 60-day money-back